Intro to NumPy#
NumPy is a Python library that brings computational power to Python and is the go-to for dealing with matrices and arrays. You can check NumPy documentation here and some beginners tutorials.
Getting started#
First of we need to install NumPy,
%pip install numpy
Requirement already satisfied: numpy in /Users/alexandre/miniconda3/envs/torch/lib/python3.9/site-packages (1.24.3)
Note: you may need to restart the kernel to use updated packages.
In order to begin using it, we need to import the library,
import numpy as np
import numpy as np loads in the NumPy library for us to use. We give a shorthand name np (could be any other name ), so every time we call something from NumPy, we use np.. This helps to keep things organized.
Arrays#
NumPy arrays are the defining feature of Numpy. Contrary to lists, Numpy arrays only accept one type of data (homogeneous) and are better at storing and retrieving data than the built-in Python list.
Most NumPy arrays have some restrictions,
All elements of the array must be of the same type of data.
Once created, the total size of the array can’t change.
The shape must be “rectangular”, not “jagged”; e.g., each row of a two-dimensional array must have the same number of columns.
In NumPy, the size of the array can be generalized to an arbitrary number of dimensions, so the fundamental array class is called ndarray.
Array fundamentals#
We initialize an array by using the np.array() function,
a = np.array([1,2,3,4,5,6,7,10,23,15])
a
array([ 1, 2, 3, 4, 5, 6, 7, 10, 23, 15])
It’s possible to access the elements of an array by using the integer index of the element within square brackets,
a[3]
4
And as the original list, Python slice notation can be used,
a[:3] # outputs the elements from the second index onwards
array([1, 2, 3])
a[:7] # outputs the first 7 elements
array([1, 2, 3, 4, 5, 6, 7])
a[3:8] # Retrieves elements from index 3 up to, but not including, index 8
array([ 4, 5, 6, 7, 10])
How to create a basic array#
Besides creating an array from a sequence of elements, NumPy provides a way to generate a set of evenly spaced values over a given interval. To do so we use the function np.linspace(), which has the syntax,
np.linspace(a,b,N)
a is the beginning of the interval, b is the end of the interval and N specifies the number of values between a and b. To create and array with 10 elements evenly space from 1 to 2 we do,
np.linspace(1,2,10)
array([1.        , 1.11111111, 1.22222222, 1.33333333, 1.44444444,
       1.55555556, 1.66666667, 1.77777778, 1.88888889, 2.        ])
We can also create an array filled with 1’s,
np.ones(10)
array([1., 1., 1., 1., 1., 1., 1., 1., 1., 1.])
or filled with 0’s,
np.zeros(10)
array([0., 0., 0., 0., 0., 0., 0., 0., 0., 0.])
Even an empty array can be created. The reason to use function empty over zeros is speed.
np.empty(2)
array([2.05833592e-312, 2.33419537e-312])
Plotting with matplotlib#
With the aid of the pyplot module we are able to visualize functions.
First, we import Matplotlib,
import matplotlib.pyplot as plt
And we have a basic framework for a plot,
Generate
xvalues: Typically, this is done using the np.linspace() function.Compute
yvalues: Usually, you define or use a function to calculate these values based on thexvalues.Create the plot: Use
plt.plot()and pass thexandyvalues to generate the plot.Customize the plot (Optional): Enhance the plot by using additional Matplotlib functions.
Display the plot: Call
plt.show()to display the plot. In the google Colab notebook, plots appear automatically after callingplt.plot(), but usingplt.show()is recommended for cleaner output and proper rendering.
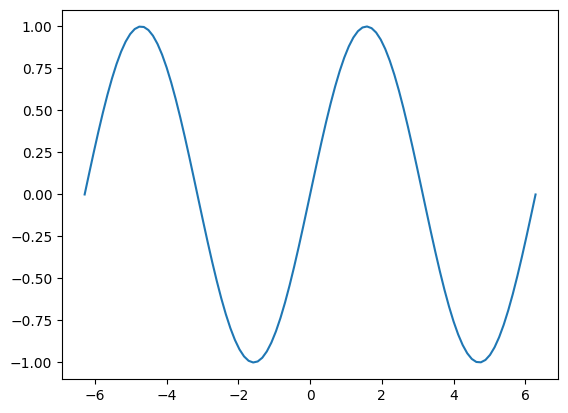
Now plotting \(\sin(x)\) over the interval \([-2\pi,2\pi]\),
#Generates the x-values
x = np.linspace(-2*np.pi,2*np.pi,100)
#Define our y as a function of x
y = np.sin(x)
#Plot the function
plt.plot(x,y)
plt.show()
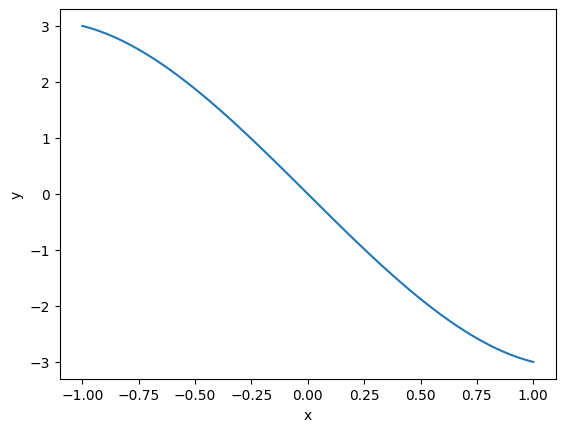
We can also define a function we want to plot. For example, plotting \(f(x) = x^3 - 4x\). First, we define our function,
def f(x):
    return x**3 - 4*x
Then we generate our x data, for example, from \([-1,1]\),
x2 = np.linspace(-1,1,100)
Now we can plot our function,
plt.plot(x2,f(x2))
plt.xlabel('x')
plt.ylabel('y')
plt.show()
There are much more to learn from the NumPy library, but this covers the essentials to start. For more information check the tutorial on their webpage.